Vector tiles with React, MapLibre and pg_tileserv
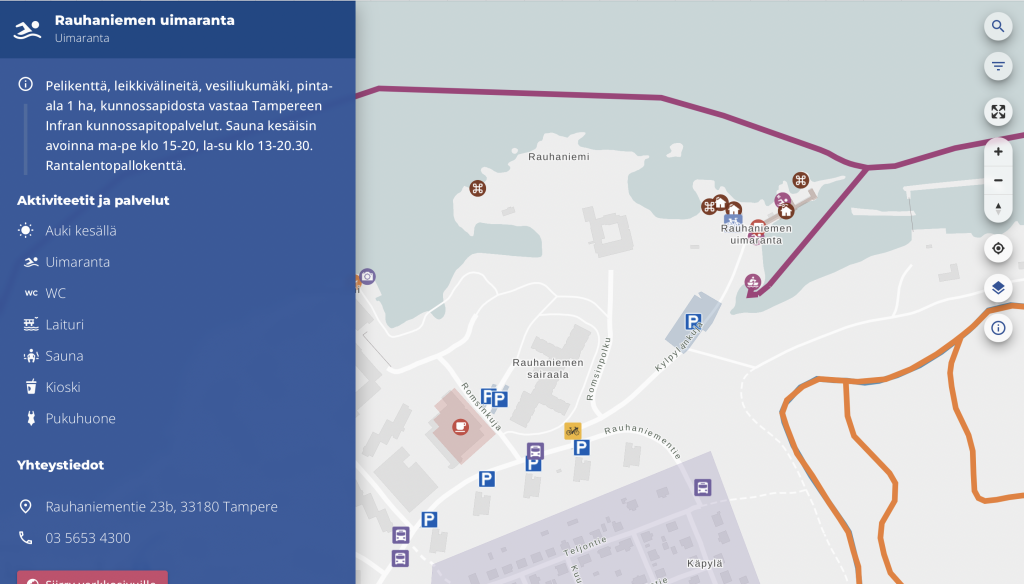
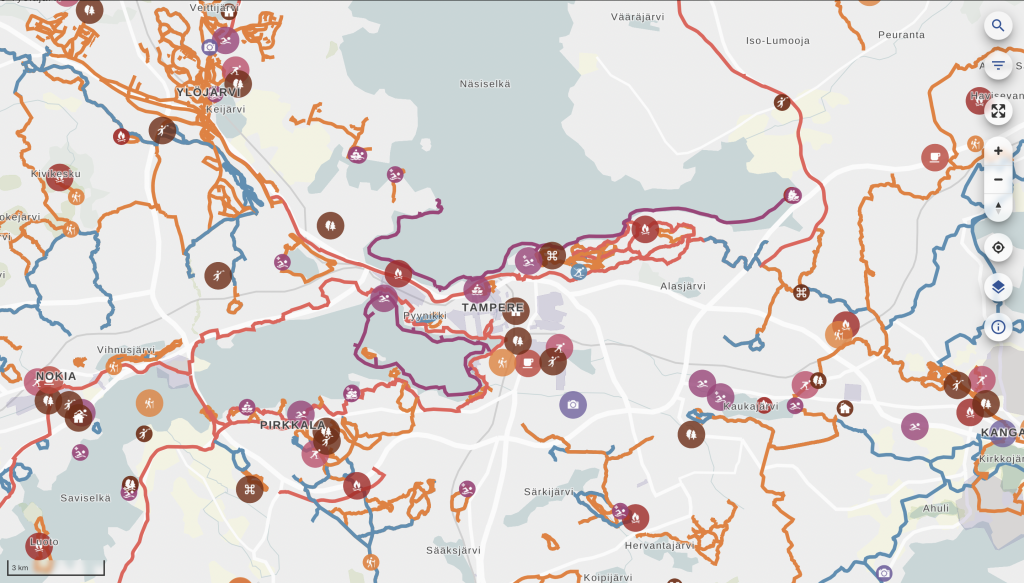
Since it’s only in Finnish at the moment, probably some of you haven’t noticed, but there is a pretty little new web map service in town – at least if your town happens to be Tampere. Gispo recently implemented a simple open-source outdoor map service called outdoorstampereregion.fi with focus on mobility and lightning-fast browsing. The service should guide anybody in the Tampere region to any outdoor activities they could ever dream of, and it works beautifully on desktop as well, though most users enjoy it on the go.

Table of Contents
Data-dependent styling: MapLibre expressions!
Zoom-dependent styling: More expressions!
Dynamic layers: URL parameters!
Introduction
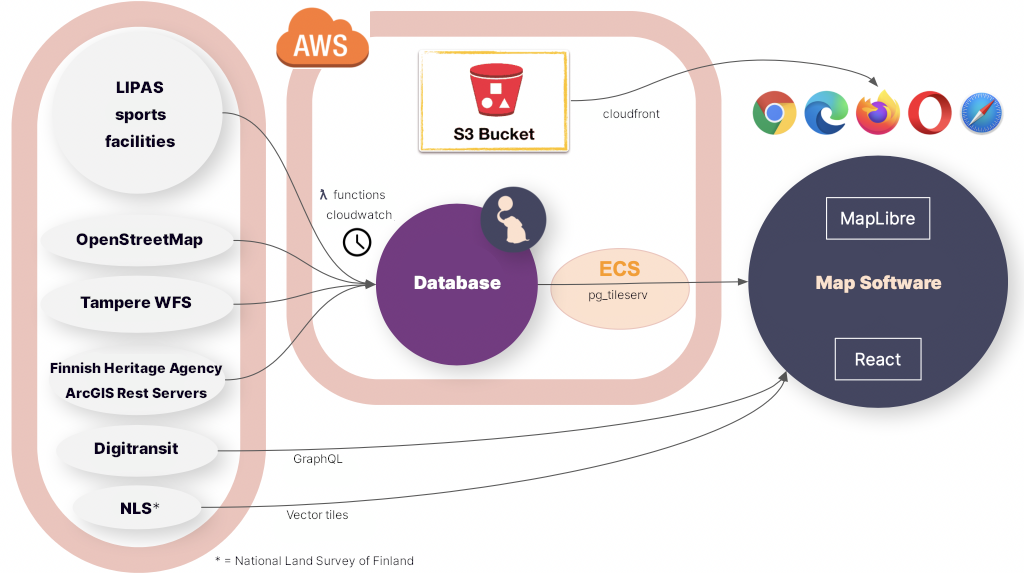
To make the service as fast and simple as possible, I could list a variety of buzzwords, but basically they boil down to two: serverless and vector tiles. So the idea is that we have all the data in a PostGIS database and serve all of it in vector tile format with a barebones tile server called pg_tileserv. Technically, serverless here means we have no custom server code, just a database and a standard container running on your favorite container platform. The whole architecture might warrant a separate blog post later on, but here we want to focus on what the user sees on their screen. I will touch on the amazing features of pg_tileserv here too at the end of the post, though.

MapLibre GL JS is the open source fork of a map technology formerly known as Mapbox GL JS v1. Due to the projects having a common history, the vector tile standard that MapLibre supports is called Mapbox Vector Tile specification.
There are at least three (perhaps four!) reasons to pick vector tiles when going forward with a modern map service:
- Performance. Since vector tiles are vector data, not pixels, you can imagine the amount of data needed to transfer all the map layers in e.g. our map above. The amount varies greatly depending on if you transfer the map images, or just the encoded vector features in the area. — Obviously, the more features there are in an area, the more data you have to transfer, but in most maps the total amount of data is much smaller if you just transfer the layer data, not the image.
- They are data. Transferring raster map tiles, that is what the user gets. A raster image, no metadata, no vector features, no properties, nothing. If you want the user to get some extra data on a feature on a raster map, you have to implement a separate API calls anyway just to query and transfer the actual feature data. Transferring vector map tiles, on the other hand, each feature can have any number of properties and additional data bundled in. — This means we can be truly serverless, i.e. we don’t have to implement a backend that serves all the structured data. Of course, here you have to be careful not to encode too much data in the properties of each feature. That may slow down rendering of the map so that *gasp* it might sometimes be almost as slow as a raster map.
- They are rendered in the browser. Partly, again, this is a performance issue, since this allows for fast rendering of things such as 3D views. Indeed, MapLibre supports 3D rendering of maps in the browser by default, and 2D rendering and zooming is blazing fast. — But this is more than just a performance issue. This also gives the tile client much more control over what the user sees. Don’t like the color of the map or the shape of the markers? Want to tweak the background when the user does something? Want to highlight some features and fade out others in response to user actions? Want to make a completely different view of the data? You are in control of what your map looks like, not just rendering tiles made by somebody else.
- Fancy extra stuff. You have to count on us on this one, or read the last chapter of this blog post, to find out all the extra things pg_tileserv can do for you out of the box.
So browser rendering is what we are talking about here. Mind you, not *all* the data has to be vector. Indeed, the Tampere outdoor map allows e.g. looking at the vector features on top of the raster aerial images of the area. MapLibre allows you to mix and match raster and vector layers to your liking.
MapLibre styles in React
So, it is MapLibre GL JS that is responsible for reading the tiled vector data and drawing the map. How the data translates to the map seen by the user is defined by the MapLibre styling specification. Among other visual things, it defines what are the data sources for the map, what are the map layers to draw and, for each layer, how features are drawn. The style spec can, of course, be provided by the tile server, or it can be bundled in the UI or, indeed, it can be dynamic so that the styles may change. The great thing here is expressions, i.e. any layout property, paint property or map filter can be an expression that depends on the data or the state of the map.
Adding dynamic map styling to a React application is made possible by react-map-gl, which is a React wrapper for Mapbox and MapLibre GL JS. What this looks like in practice is a React component that just needs some props and child components:
<MapGL
  ref={mapReference as Ref<MapRef>}
  initialViewState={{
        latitude: 61.498,
        longitude: 23.7747,
        zoom: zoom,
        bearing: 0,
        pitch: 0,
  }}
  style={{ width: "100vw", height: "100vh" }}
  mapLib={maplibregl}
  mapStyle={mapStyle}
  onResize={toggleNav}
  styleDiffing={false}
>
  {/* Area polygons */}
  <Source id={LayerId.OsmArea} {...OSM_AREA_SOURCE}>
    <Layer {...{ ...OSM_AREA_STYLE, filter: categoryFilter }} />
  </Source>

  {/* Linestrings */}
  <Source id={LayerId.LipasLine} {...LIPAS_LINE_SOURCE}>
    <Layer {...{ ...LIPAS_LINE_STYLE,
        filter: categoryFilter,
        layout: {
          visibility: searchString === "" ? "visible" : "none",
        }, }} />
  </Source>

  {/* Points */}
  <Source id={LayerId.Point} {...POINT_SOURCE}>
    <Layer
      {...{
        ...POINT_STYLE_CIRCLE,
        filter: categoryFilter,
        layout: {
          visibility: searchString === "" ? "visible" : "none",
        },
      }}
    <Layer
      {...{
        ...POINT_STYLE_SYMBOL,
        filter: categoryFilter,
        layout: {
          ...(POINT_STYLE_SYMBOL as SymbolLayer).layout,
          visibility: searchString === "" ? "visible" : "none",
        },
      }}
    />
  />
</MapGL>
This is a simplified example of our actual outdoor map component. The example above renders a MapLibre map with four layers, three of which have a different vector tile source:
- Polygon layer from a vector tile source that provides some polygons from OpenStreetMap
- LineString layer from a vector tile source that provides some outdoor exercise tracks (line strings)
- Circle layer from a vector tile source that provides some outdoor exercise points
- Symbol layer from the same vector tile source that provides some outdoor exercise points
Instead of a single big style json file, this allows us to provide any data to any MapLibre layer as React props. Since we have a huge amount of data, we define all the layer styles in a separate style.ts file:
- known id strings for each layer so we can refer to the right layer
- source objects for each layer that tell MapLibre what is the address of the vector tiles, e.g.
export const OSM_AREA_SOURCE: VectorSource = {
  type: "vector",
  tiles: [
    `${process.env.TILESERVER_URL}/kooste.osm_alueet/{z}/{x}/{y}.pbf?filter=deleted=false`,
  ],
  minzoom: 0,
  maxzoom: 22,
};- style objects for each layer that tell Maplibre how to render the layer, e.g.
export const OSM_AREA_STYLE: LayerProps = {
  "id": LayerId.OsmArea,
  "source": LayerId.OsmArea,
  "source-layer": "kooste.osm_alueet",
  "type": "fill",
  "paint": FILL_PAINT,
  "minzoom": 13,
};
These style objects can be as simple or as complex as we desire. In general, we define the static style objects in style.ts.
“Static” here means that the styles may depend on the data in all kinds of exotic ways, but they do not depend on React state. In addition, as seen above, it is possible to introduce dependencies to the React state simply in the Layer props passed on to the layer. In our case, we have an object called categoryFilter that changes when the user clicks around in the interface, and triggers various data on each layer to be visible or invisible.
Another React prop that affects the visibility of layers is searchString. You can see that point and line layers will get visibility value true if searchString is empty. However, once the user starts typing in a search field, we don’t want to display all the features on the map; all the default layers are rendered invisible if the user has entered search mode.
Data-dependent styling: MapLibre expressions!
First, let’s focus on the style.ts that does not depend on React state. Our example above is already a good starting point. OSM_AREA_STYLE says that our OSM polygons should be painted with FILL_PAINT. What is that? Well, just another kind of object:
/**
 * Paint object for all area layers
 */
const FILL_PAINT: FillPaint = {
  "fill-color": COLOR_MATCH,
  "fill-opacity": 0.2,
};
Nice! So, it tells me to draw the OSM polygons with opacity 0.2 and the color COLOR_MATCH. Pray tell, what color is that? Well, it’s not actually a single color:
const COLOR_MATCH: Expression = [
  "match",
  ["string", ["get", "tarmo_category"]],
  "Luistelu",
  getCategoryColor("Luistelu"),
  "Uinti",
  getCategoryColor("Uinti"),
  "Kahvilat ja kioskit",
  getCategoryColor("Kahvilat ja kioskit"),
  palette.primary.dark,
]
This is a shortened version of all the possible object categories in our outdoor map. This is a MapLibre expression that depends on the tarmo_category property of the vector object. We will get different colors for the color fill depending on what kind of a polygon we are drawing.
In addition to color, obviously any layout or drawing property may depend on the data in a variety of ways. In our outdoor map, each point has a colored circle and a symbol. The circle color is selected like above. In addition to circles, we had the second point layer, which displays symbols for the same data:
export const POINT_STYLE_SYMBOL: LayerProps = {
  "id": LayerId.Point,
  "source": LayerId.Point,
  "source-layer": "kooste.all_points",
  "type": "symbol",
  "layout": SYMBOL_LAYOUT,
  "minzoom": 14,
};
Again, SYMBOL_LAYOUT is something that can depend on the data:
/**
 * Layout object for all symbol layers
 */
const SYMBOL_LAYOUT: SymbolLayout = {
  "icon-image": [
    "match",
    ["string", ["get", "tarmo_category"]],
    "Luistelu",
    "skating",
    "Uinti",
    "swimming",
    "Kahvilat ja kioskit",
    "cafe",
    /* In some categories (looking at you, parking) icons are determined by osm tags */
    /* We could also select icon based on type_name, but this will do for now */
    ["get", "amenity"],
  ],
  "icon-size": [
    "match",
    ["string", ["get", "tarmo_category"]],
    "Pysäköinti",
    1,
    0.75
  ],
  "icon-allow-overlap": true,
};
This has some weird things because we actually want to display icons based on tarmo_category or in some cases, original OpenStreetMap amenity tag, so we can have different parking and bicycle parking icons, even though they both belong to the Pysäköinti (Parking) category. Also, we want to render parking icons larger than other service icons, since they look different anyway.

Zoom-dependent styling: More expressions!
Finally, it is possible for the icons and layers to depend on zoom. You probably didn’t notice that in POINT_STYLE_SYMBOL, minZoom is set to 14. This means that below zoom level 14, this layer is not rendered.
The trick here is that in actual code, we have lots of different layers depending on zoom level. This may not be the most elegant solution, but it is one we came up with to allow clustering points when the user is further away. Clustering (combining) feature data that has been already loaded to Maplibre layers proved tricky, so what we did is actually create lots of PostGIS views of all point layers in the database. Called point_clusters_8 all the way to point_clusters_13, we have a different vector layer for each zoom level, and all points within a given distance of each other are clustered on each level to provide a view like this when the map is zoomed out. When the user zooms in, the visible layer will change, and they will see more clusters or points in place of these clusters:

export const POINT_CLUSTER_9_STYLE_CIRCLE: LayerProps = {
  "id": `${LayerId.PointCluster9}-circle`,
  "source": LayerId.PointCluster9,
  "source-layer": "kooste.point_clusters_9",
  "type": "circle",
  "paint": CLUSTER_CIRCLE_PAINT,
  "minzoom": 9,
  "maxzoom": 10,
};
The code snippet above is a Maplibre style that will render the kooste.point_clusters_9 layer only in the right zoom range. All these layers contain both single points and clusters at each zoom. The way to render them differently is
/**
 * Point cluster layers at zoom levels below 14
 */
const CLUSTER_CIRCLE_PAINT: CirclePaint = {
  // indicate more spread out clusters by increasing the size when zooming in
  ...CIRCLE_PAINT,
  "circle-radius": [
    "interpolate",
    ["linear"],
    ["zoom"],
    8,
    ["match", ["number", ["get", "size"]], 1, circleRadius, 1.2 * circleRadius],
    13,
    ["match", ["number", ["get", "size"]], 1, circleRadius, 2 * circleRadius],
  ],
  "circle-opacity": [
    "interpolate",
    ["linear"],
    ["zoom"],
    8,
    ["match", ["number", ["get", "size"]], 1, 0.9, 0.9],
    13,
    ["match", ["number", ["get", "size"]], 1, 0.9, 0.7],
  ],
};
This snippet renders either a standard sized circle for single clusters or a larger circle if the cluster should have multiple points.
The radius of the circle could be made to depend on the size of the cluster, but it might not be very clear or informative; rather, the radius is made to depend on the zoom level. This illustrates the fact that the clustering radius (and the number of clusters) is dependent on the zoom level. interpolate is a MapLibre expression that scales the size linearly depending on zoom level, from level 8 to 13. circleRadius is a constant that can be easily tweaked to adjust the size of all symbols. We handle opacity similarly: even as clusters get smaller at smaller zooms, we want to make them more opaque to illustrate that the points are most likely located underneath the clusters. This is by no means a perfect way to illustrate clusters: it is always a tricky thing to do, especially as the technology underneath dictates how they are plotted in the first place.
Dynamic layers: URL parameters!
There are certainly lots of other ways the React state, the zoom level, data and other properties could be tweaked to improve the Maplibre visualization and make it respond to user actions and the state of the application. Some of these will certainly be introduced in the outdoor map in the future, since we will be developing the software further together with the municipally owned company Ekokumppanit. However, I want to show one more trick the vector tiles have up their sleeve: namely, filtering capabilities that mean our default pg_tileserv installation is very close to providing a full-fledged API to all our data out of the box, no configuration needed!

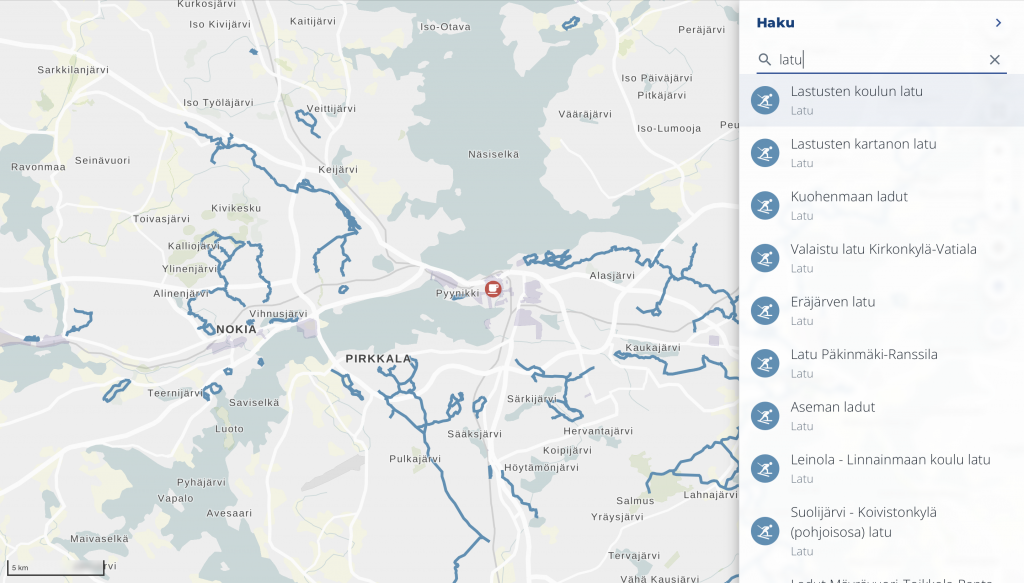
You may have noticed that outdoorstampere.fi actually has a functional, albeit simple, search box built in. Start typing a string, and you are shown all the objects in the area containing that string in a split-second. Click on one on the list and it will center the map to the corresponding feature. It was so fast that we had to slow it down not to confuse the user, because interim results would show up and confuse the user whenever they would start typing.
How is it implemented, then, if there is no API whatsoever to the data? Well, there kinda is. In addition to rendering vector tiles, pg_tileserv knows how to query the database with any filtering expressions. This means our UI can actually request tiles from the server with a URL containing any database queries in CQL. This allows us to actually create a Maplibre layer whose URL parameters change when the React state changes. At every letter, the layer is reloaded. This is implemented with
/**
 * Dynamic search point layer. Maxzoom defines the size of the tile
 * used to search for the input string when zoomed in.
 */

export const SEARCH_POINT_SOURCE: VectorSource = {
  type: "vector",
  tiles: [
    `${process.env.TILESERVER_URL}/kooste.all_points/{z}/{x}/{y}.pbf?filter=${cityFilterParam}%20AND%20(name%20ILIKE%20'%25{searchString}%25'%20OR%20type_name%20ILIKE%20'%25{searchString}%25'%20OR%20tarmo_category%20ILIKE%20'%25{searchString}%25')`,
  ],
  minzoom: 0,
  maxzoom: 6,
};
If this looks ugly, don’t worry; we just happen to have a few CQL expressions in all the URLs thrown in for good measure. Firstly, we have a city filter that is actually defined as const cityFilterParam = cityName%20IN%20(${process.env.CITIES}); . This one will only load features having the right city name strings, so we don’t load data outside our area of interest. {searchString}, then, is a placeholder string that can be replaced with the current React props in the Map render method:
{/* Dynamic search layer*/}
<Source
 id={LayerId.SearchPoint}
  {...{
    ...SEARCH_POINT_SOURCE,
    tiles: [SEARCH_POINT_SOURCE.tiles![0].replaceAll('{searchString}', searchString)],
  }}
>
  <Layer
    {...{
      ...SEARCH_STYLE_CIRCLE,
      filter: categoryFilter,
      layout: {
        visibility: searchString === "" ? "none" : "visible",
      },
    }}
  />
  <Layer
    {...{
      ...SEARCH_STYLE_SYMBOL,
      filter: categoryFilter,
      layout: {
        ...(SEARCH_STYLE_SYMBOL as SymbolLayer).layout,
        visibility: searchString === "" ? "none" : "visible",
      },
    }}
  />
</Source>
So, when the user starts typing a search string, the search layer appears and reloads the tiles whenever the string changes!
The caveat here, of course, is that this is still a tiled server. There is no way you can do a global search to all the map data when the map is zoomed in: the map only loads those tiles that are visible at the moment.
It depends on the intended usage whether this is a feature or a bug. In general, of course, the user might be interested in their surroundings, not a location very far away; and luckily, ours is a local, not global, map service. The easy way around this is not to provide the search layer with too large a zoom. In our case, the maximum zoom level for the search layer is 6, which means that whenever the user is zoomed in, the search will happen on the local tile on that zoom level. It pretty much covers the whole area of our map.
Another way to handle the situation would be to zoom out whenever search starts, to indicate to the user that we are searching on a larger area. However, we think the user may not want to lose the local context, so we rather just display the list of the results and allow the user to click on them to pan to the selected feature at the current zoom level.
Conclusion
This shows you that pg_tileserv is actually a very fast queryable client to your PostGIS instance. When indexes are set up correctly for all the fields you want to filter with, any queries to the database really produce tiles lightning-fast. And React bindings to Maplibre allow you to create a UI that a) instantly loads different data depending on user interactions, and/or b) styles the existing data differently depending on user interactions, UI state and the data itself.
Since pg_tileserv can do PostgreSQL queries, it can of course also query e.g. PostGIS functions. We haven’t yet tried out layers that are dynamically generated on the backend by simpler or more complex SQL functions. They might come in useful in a variety of use cases in the future, though. Similarly, Maplibre on the frontend is constantly evolving, getting close to v3 release at the moment, providing new ways of visualizing our vector data. In all, the two feel like a very promising combination of cutting-edge technologies that allows developing fast and responsive web maps for a long time to come.
All the code of outdoorstampereregion.fi, including the snippets presented here, is open source and available on Github.
