QGIS plugin and trajectories for traffic analysis
Three LiDARs have been monitoring traffic around Esplanadi in Helsinki from November 2023 to August 2024. The data was collected by Flow Analytics and it can be downloaded here: https://flow-portal.com/ (requires registration). After the data collection, all that was missing was a tool to analyze all this data.
We had the pleasure to work a project with Forum Virium Helsinki, the aim was to develop a tool capable of analyzing the data collected by the LiDARs and to conduct a small analysis on this experimental data. The end users of this tool would be the traffic researchers of the city of Helsinki. As LiDARs allow collection of more data than more traditional traffic counting methods, their use can be expected to increase.
We decided to implement the tool as a QGIS plugin which was named FVH-3T (Forum Virium Helsinki – Traffic Trajectory Toolkit). The plugin consists of two buttons and three QGIS processing algorithms. Its use is very simple: first, the user imports a traffic point layer into QGIS and creates an empty gate and area layer using the buttons in the Plugins toolbar. Next, the user draws gates and areas in locations where they wish to study traffic.
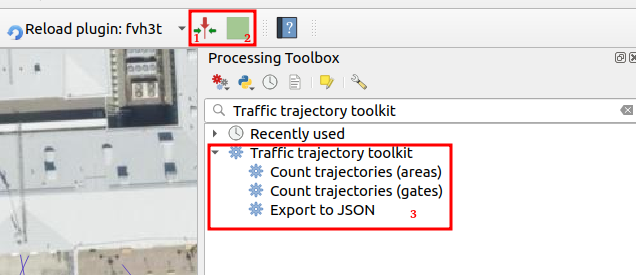
When the gates and areas are drawn, it is time to run a processing algorithm. There are three of them in the FVH-3T plugin: The first two are for the actual traffic census while the third one is for exporting the results computed by the gates into JSON-format. Before running either of the two “Count trajectories” processing algorithms, the user can set a desired timeframe for the calculations as well as the class of traveler. Running the processing algorithm creates trajectories from the point data and calculates some movement statistics both for them and the user-drawn gates/areas. Both processing algorithms can either be run as a single process, or split the studied timeframe into several smaller intervals ussing the QGIS batch processing interface.
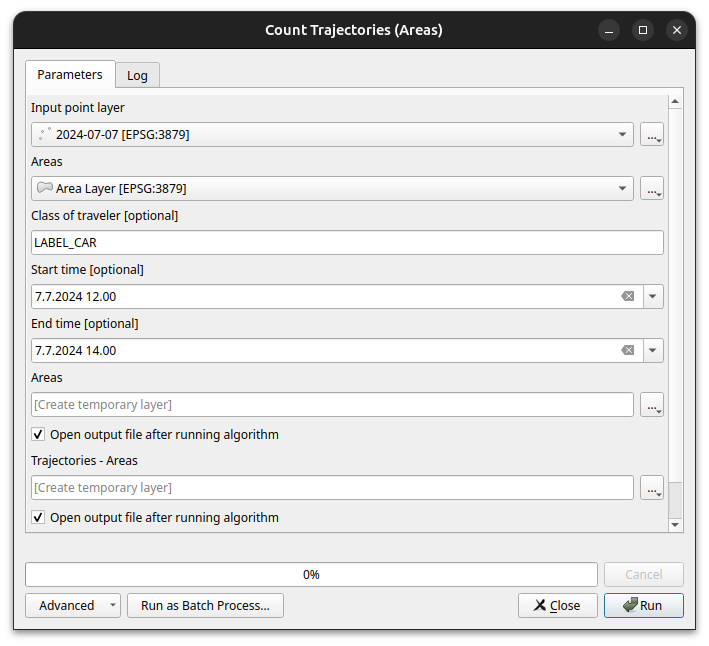
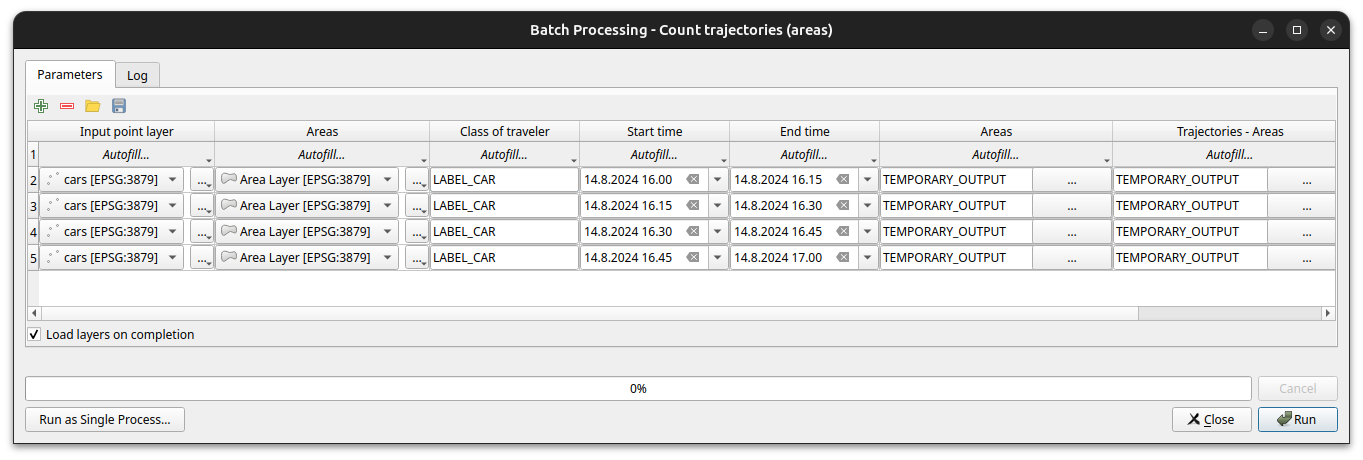
As stated above, running the processing algorithm draws trajectories from the point data. When running the “Count trajectories (areas)”, trajectories are generated only for points inside the user-drawn areas while when running the “Count trajectories (gates)”, trajectories are created for all points in the set timeframe.
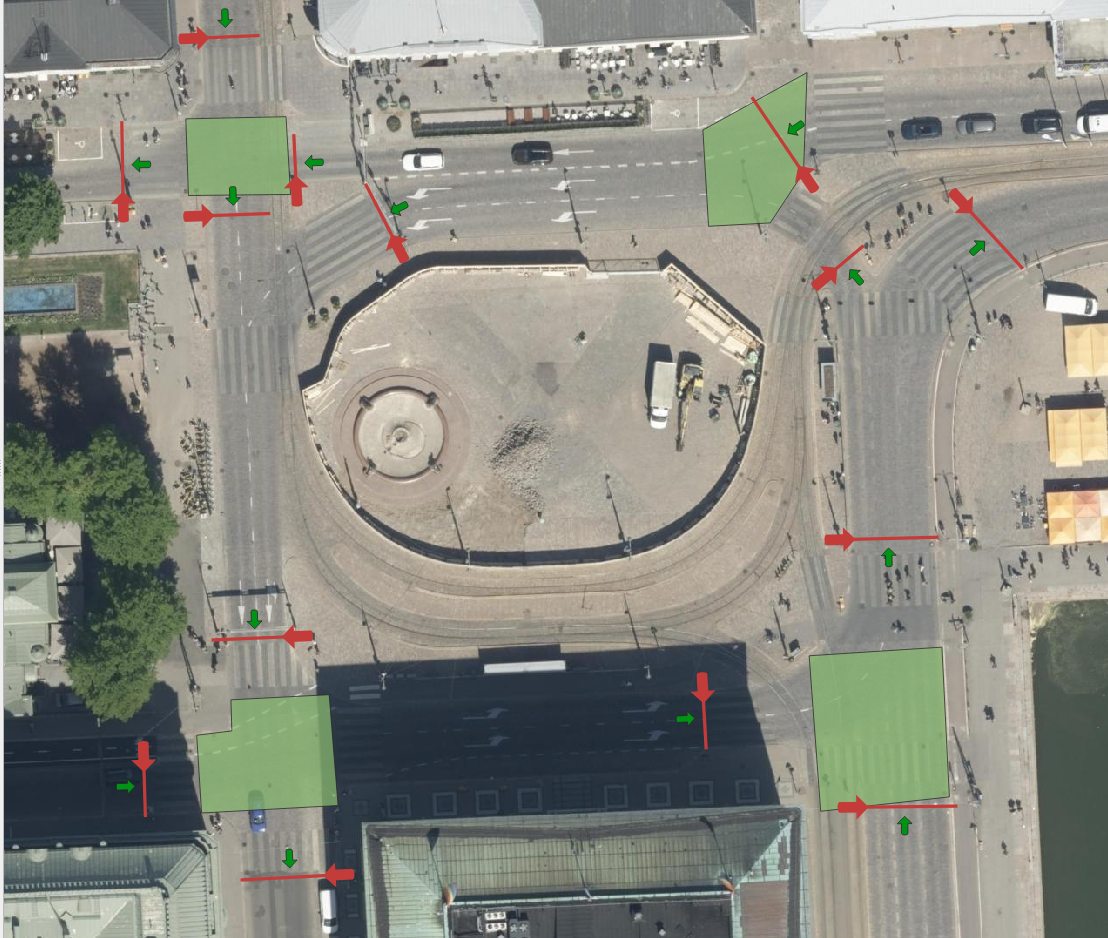
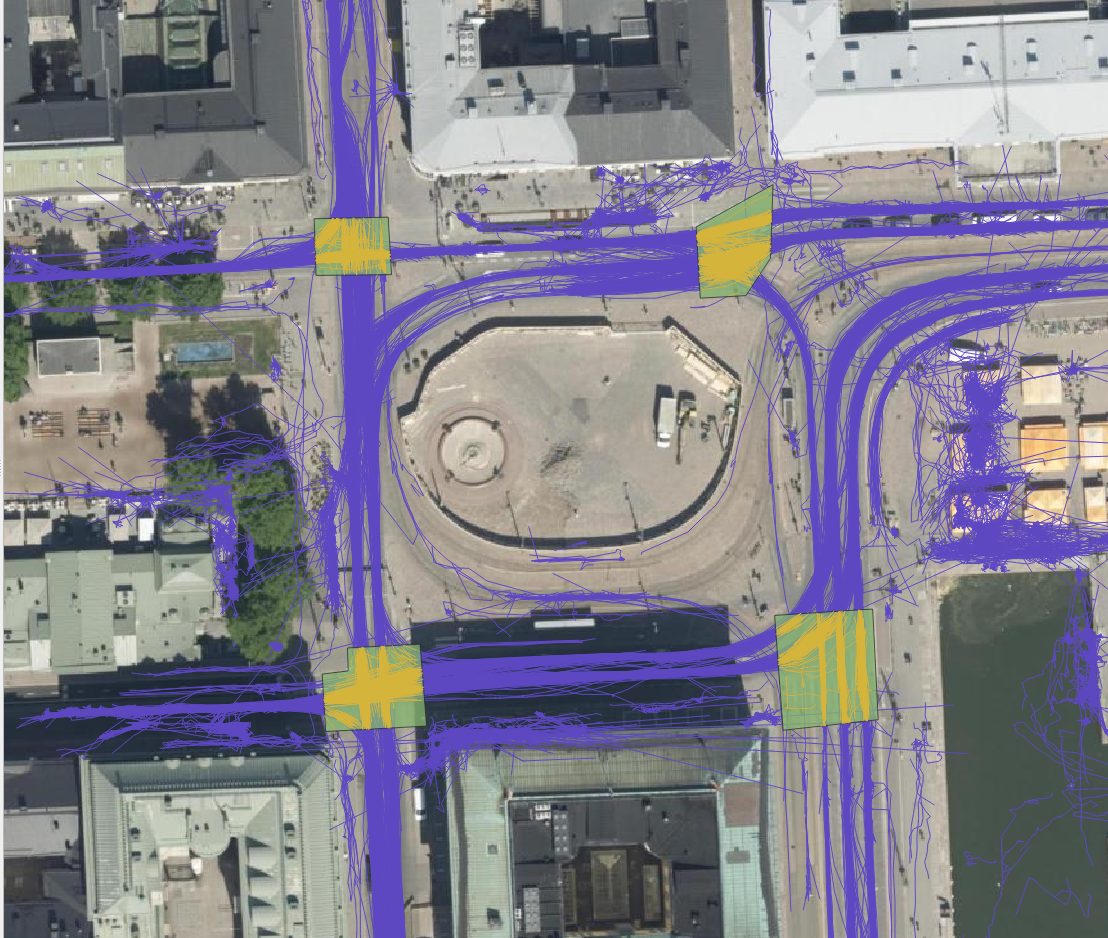
For each trajectory, length, duration, and average and maximum speeds are computed. For each area drawn by the user, the number of trajectories that it intersects are counted as well as their average speed. This allows, for example, to study congestion at intersections. For each gate, the number of intersecting trajectories per direction and the average instantaneous speed and acceleration of the intersecting trajectories are calculated. Gates are thus used to analyse traffic census. They can also be used to analyse pedestrian crossings.


The FVH-3T QGIS plugin can be used for analysing traffic flow on the general level as well as for more detailed study of individual travellers. Trajectories can be used, for example, to study how diligently pedestrians use crossings or whether many cross the driveways at the wrong place. Similarly, it can be studied whether cyclists use the cycle lanes intended for them, do they follow the intended direction of cycle lanes or do they find other paths. Gates can be used to study traffic volumes, speeds and accelerations at desired locations, and whether some cars or cyclists go in the wrong directions. With areas it is possible to analyse, for example, how badly intersections get congested.
In our small analysis, we discovered, for example, that car volumes were on average the highest on Fridays and lowest on Sundays during the observation period. In contrast, we did not observe any particular day of the week when average speeds at intersections were significantly higher or lower than average, but we did find some specific dates when the average speed in intersection(s) was lower than usual. These were usually days, when there were a lot of pedestrians in the area. For example, the 15th of August was one of these slower days, and on that date the Night of Arts brought several concerts to the area.
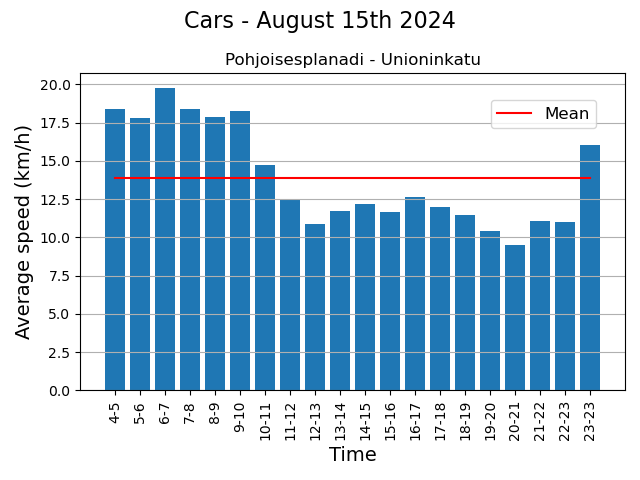
These eventful days also showed that the LiDARs were able to monitor individual pedestrians in the crowd. Regarding the pedestrian movements, we found, for example, that although the majority use crossings conscientiously, it is still quite common to cross the driveway at the wrong place. Similarly, although the cycle lanes in the Esplanadi area are in active use, some cyclists use the pedestrian lanes.
The project was interesting, not the least because we got develop a tool and the to try out the tool in practice, and also to learn the basics of traffic analysis. One of the greatest benefits of the tool is that the researcher can draw the areas and gates to those locations they are interested in and in the scale they are interested in.
