Analyzing school accessibility on QGIS
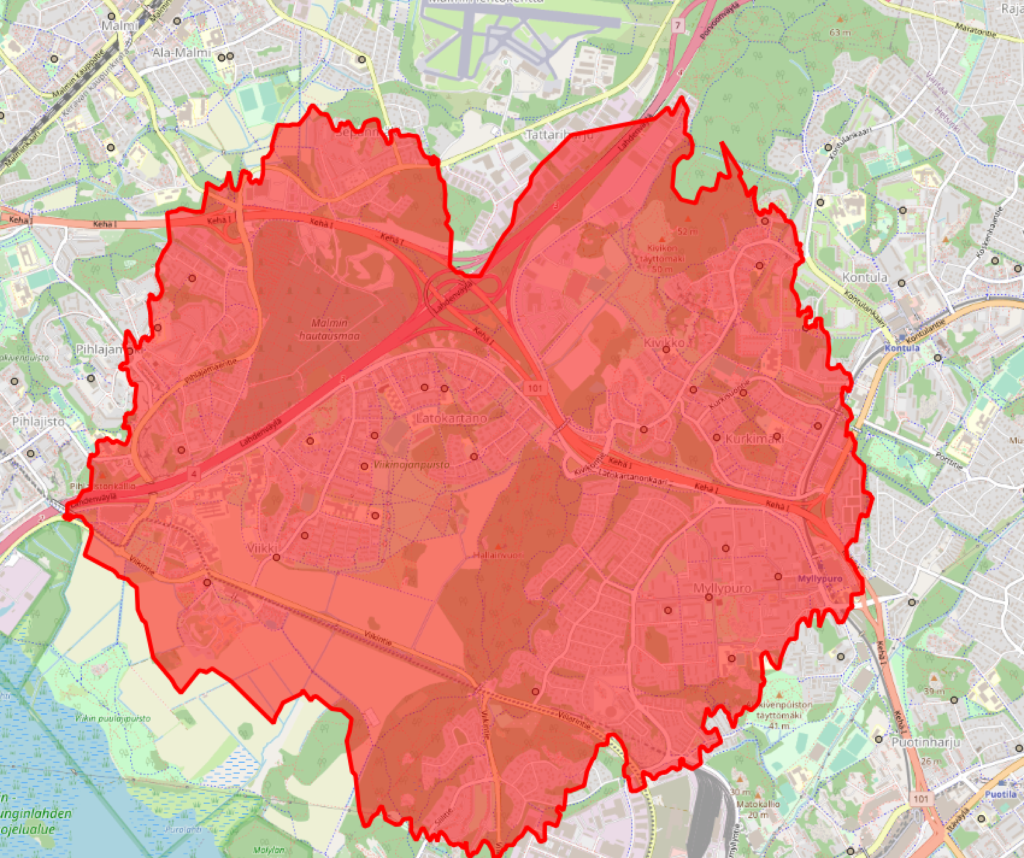
Improving access to education is one of the major challenges faced by educational planners and managers worldwide. Placement and distribution of schools across various neighborhoods and cities may vary greatly within a single metropolitan area, in rural areas as well as nationwide. To improve the methods available to local governments in analyzing school placement and accessibility, Gispo worked together with Unesco IIEP to develop a simple methodology that would allow educational planners to use a QGIS plugin to fetch, visualize, and analyse the catchment areas of schools based on OpenStreetMap road network access.
What is it about, exactly?
Polygons around a point that show the distance travelled from the point in given time interval are called isochrones, i.e. polygons of constant time. There are various different ways of constructing isochrones for points, depending on the amount of data available on the surroundings.
Ideally, we might want to have a complete 3D view of the landscape surrounding all points. That would allow us to completely model factors such as terrain, possible paths or possibilities to roam across the terrain and take shortcuts, and even factor in the evenness or hilliness of the terrain to the travel time of an individual to reach a certain point. Still, even this data would not tell us if we are wandering through a mine field, ancestry land, private property or perhaps a particularly large bloat of hippopotamus.
Also, in practice no such datasets exist for all areas of the world. While height maps and even terrain or land cover data might exist, such data does not tell us whether the terrain is actually locally traversable by foot. In most cases, even pedestrian access will take place on roads and pre-existing paths. Here, we are in luck, because OpenStreetMap forms the largest known global database of human-traversable paths. Also, using Openstreetmap data, we may consider other forms of transport, such as cycling, as we may have information on the type of path and its suitability for e.g. cycling or car access.
“The purpose of the methodology is not to find any possible way to travel to school,” says Amelie Gagnon, Development Lead at IIEP-UNESCO, “but rather to investigate the safest paths for learners to go to school, and eventually mobilise these same travel routes for other purposes (e.g. inspection circuits, delivery of textbooks, mobile libraries, school meals, etc.)”
When limiting our datasets to a network of paths, the problem also becomes more easily solved for a large number of points relatively quickly. Multiple algorithms exist for calculating the shortest path in a graph from point A to B; in this case, we want to find the shortest path to all points in the network surrounding a certain point, up to a given distance. This is called the shortest-path tree of a given point.
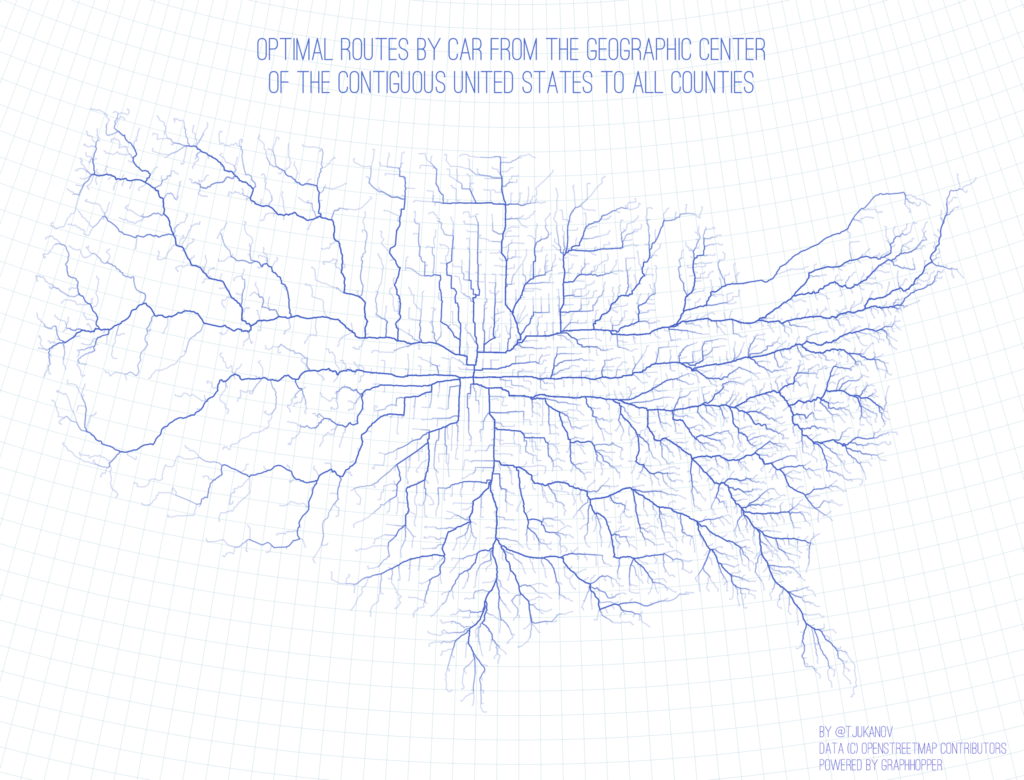
Luckily, even this needs not be implemented from scratch, as there are a variety of optimized open-source routing software components that also allow calculating shortest-path trees for points. We can pick and choose the one most suitable for the needs of educational planning, since their performance for this specific task varies greatly. A review of various open-source solutions, most of which support calculating isochrones, can be found here. Just add traveling time to the tree above, and you will have the tree up to a desired distance (e.g. 5 minutes by foot, 8 hours by car, or anything in between). Our dear colleague Topi’s website contains an animation by distance of the graph above.
With a dataset as huge as OpenStreetMap paths, and the desire to calculate travel times also over long distances (up to 60 minutes by foot or even car), the performance of the algorithm in a huge graph becomes the most important factor in our selection. Due to its performance in large networks, our pick is GraphHopper. It employs a method called contraction hierarchies, which preprocesses the graph so that important long-range nodes are saved separately from the entire network. This allows fast routing over long distances with a small amount of nodes, while retaining also the small-scale network for short-distance routing.
The plugin
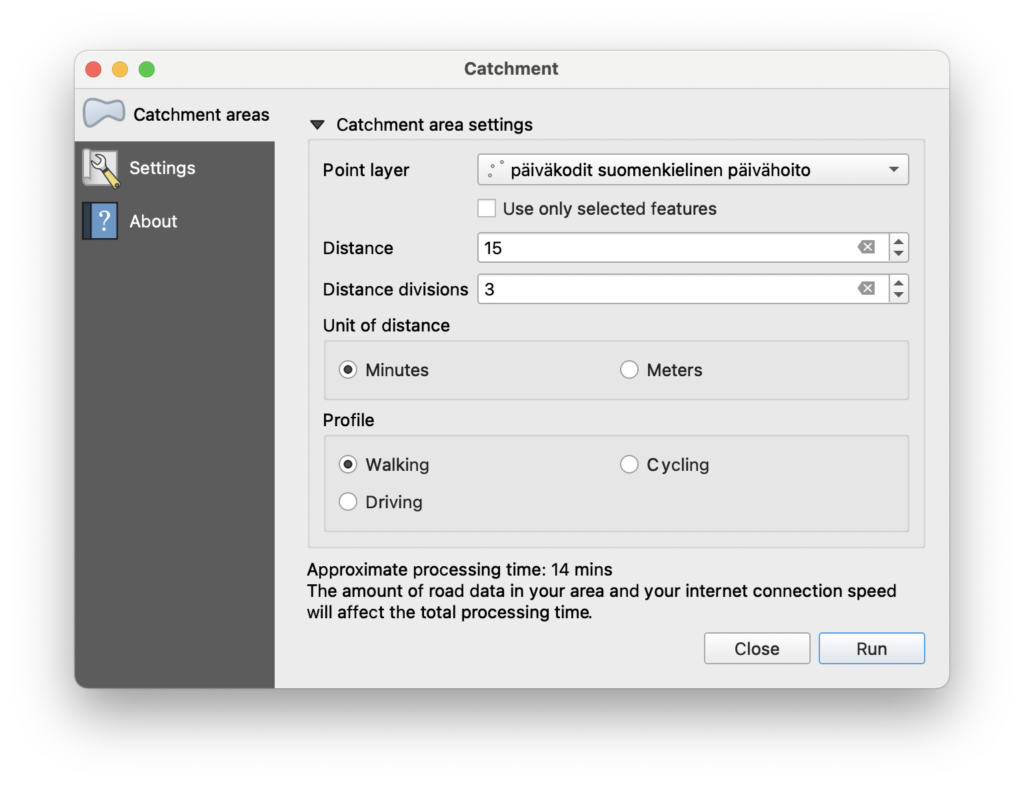
So, the proposed solution is twofold: 1) a QGIS plugin that allows the user to select the parameters for calculation, such as the points (or a whole point layer) we want to calculate the trees for, along with desired travel mode (walking, cycling, driving) and travel distance, and 2) a GraphHopper backend that contains all the OpenStreetMap data for the desired countries and which will process the QGIS plugin request.
Here, we must note a few things. Since the OSM network is indeed huge, processing the data to get a routable graph containing all walkable paths requires memory. Lots of it. Having the single GraphHopper instance process the graph(s) for the entire planet is sadly not feasible with current memory prices and availability limitations. We have to limit the instance to the country or countries we are interested in. Another limitation, obviously, is processing time. While trees for up to two hours of walking can be constructed relatively fast for a number of points, cycling or indeed driving for two hours would make the graph so huge that it becomes prohibitively slow to calculate. Therefore, we had to add a rough estimate of the processing time so the user knows if they are initiating a particularly slow query (or, indeed, a query that would take hours or days to calculate).
So what are the results?
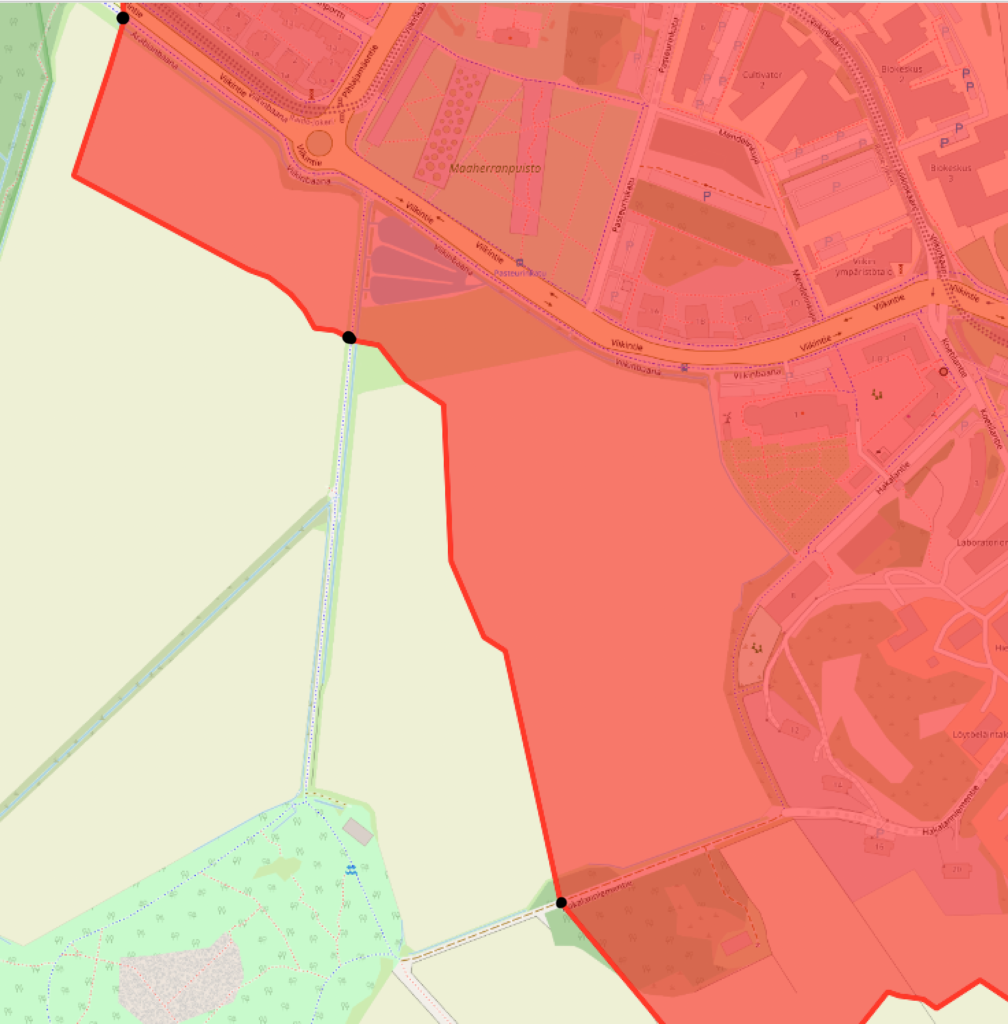
Then, on to the nitty-gritty. We haven’t discussed how we actually get the catchment area from the shortest-path tree. What GraphHopper actually calculates is just a tree, i.e. points in the road network we can reach in the given time. In the picture above, our GraphHopper result in this part of the boundary consists of three points. How does GraphHopper calculate the whole boundary out of these points?
We must keep in mind that at the moment, we have no terrain data. GraphHopper doesn’t know if there is water, woods, fields or unknown roads between the roads in the OpenStreetMap graph. If we use the road network alone, we have to guess the shape of the boundary based on it. What GraphHopper does is snap all points in the area to the closest road, whether outside or inside the catchment area, and assumes access to the area is always by the closest road. Further, this snapping distance to roads cannot currently be adjusted in GraphHopper parameters. Therefore, we are left with some guesswork.
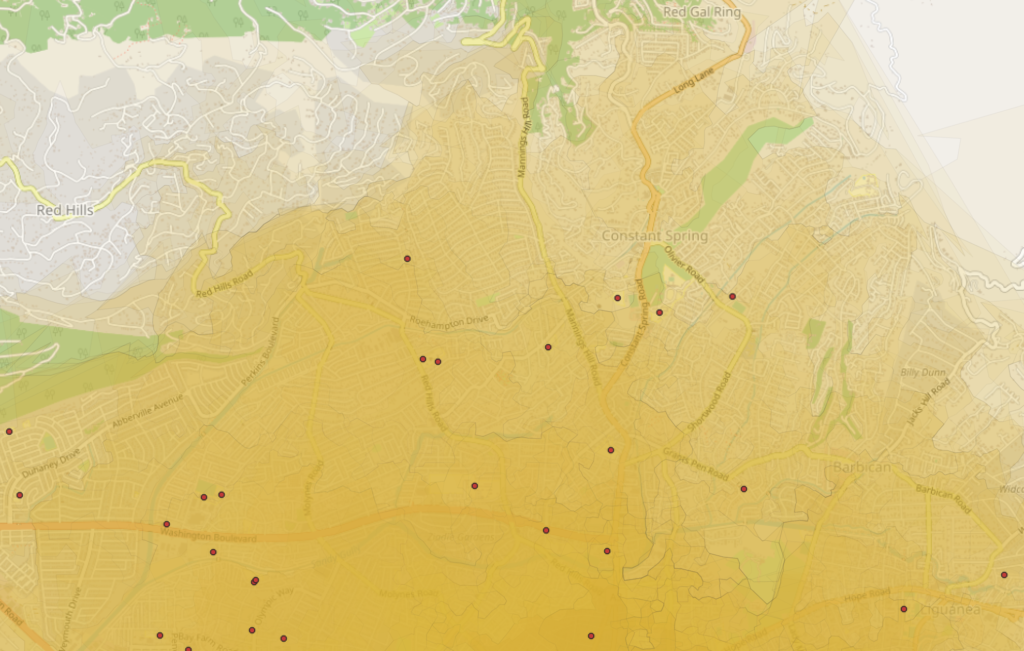
In cases with comprehensive path networks available in Openstreetmap, like the picture above, there are so many paths that the polygon between the roads will be rather sensible. This means also that the area of the catchment polygon is close to the actual catchment area of the school.
A complete road network comprehensively mapped on OSM provides optimum results, and can reflect very well the situation on the ground. One such example is Jamaica, where a very detailed road network is available on OSM, so an isochrone analysis shows the actual accessibility of students to schools when walking.
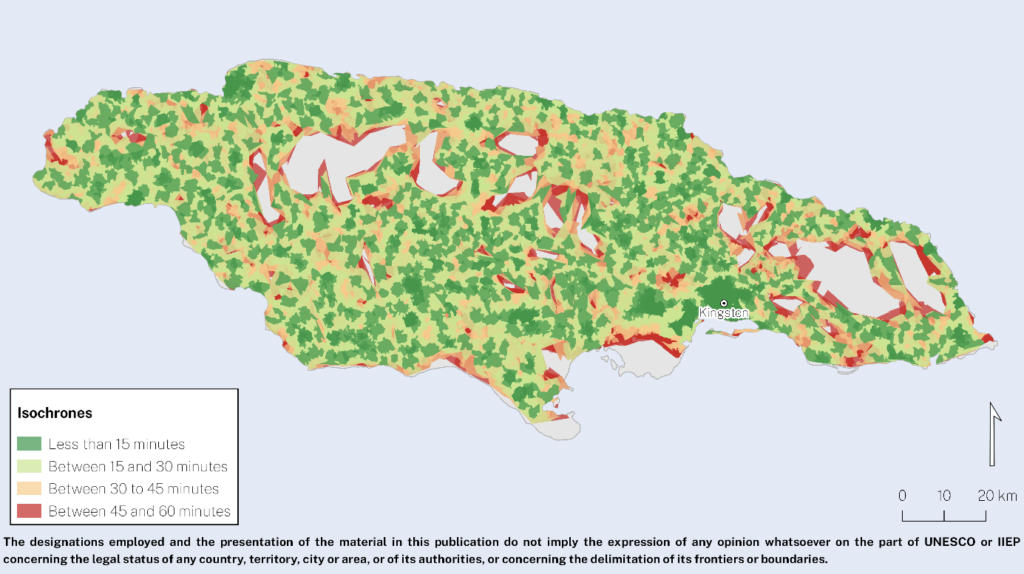
“Working together with the Jamaican Ministry of Education, Youth, and Information, we could test the plugin, examine the results and start discussing interesting insights for future policy responses,” says Amelie Gagnon. The figure above shows the isochrones mapped around primary education schools in the country. Isochrones could be drawn for all schools but two, which will be investigated further. What can be calculated, though, is that about half of the Jamaican primary school-age population can walk to school in less than 30 minutes, across the country, and 81% of the primary school-age population can get to school by walking for less than 60 minutes.
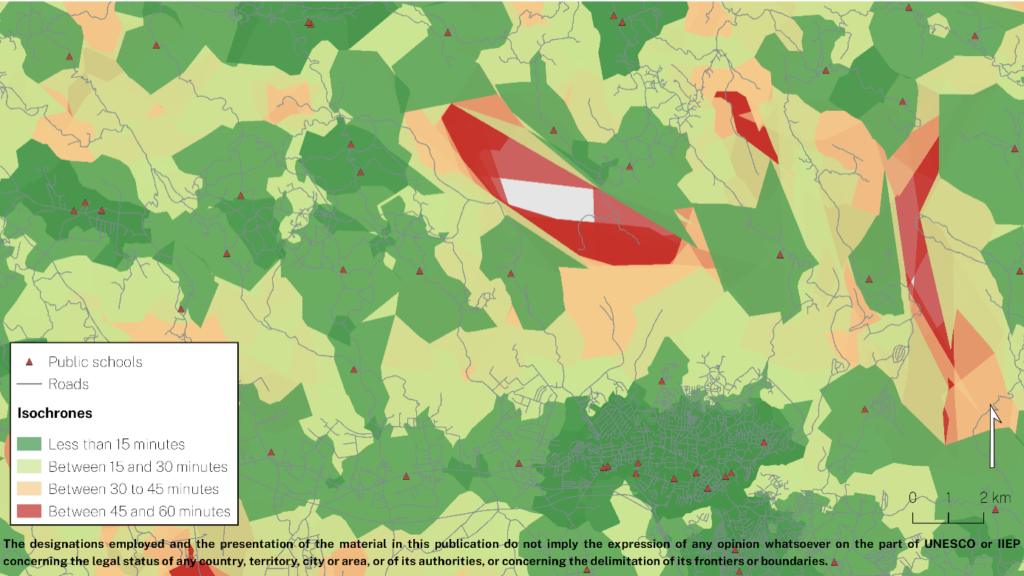
“Providing suitable conditions for learning start when students leave their home, not when arriving to school: a child walking 120 minutes to school will learn very differently than another who walks 20. For Ministries engaged in micro-planning, this tool is extremely useful to distinguish actual access from illusory access”
– Amelie A. Gagnon, Senior Programme Specialist leading the Development Cluster at IIEP-UNESCO in Paris.
Limitations
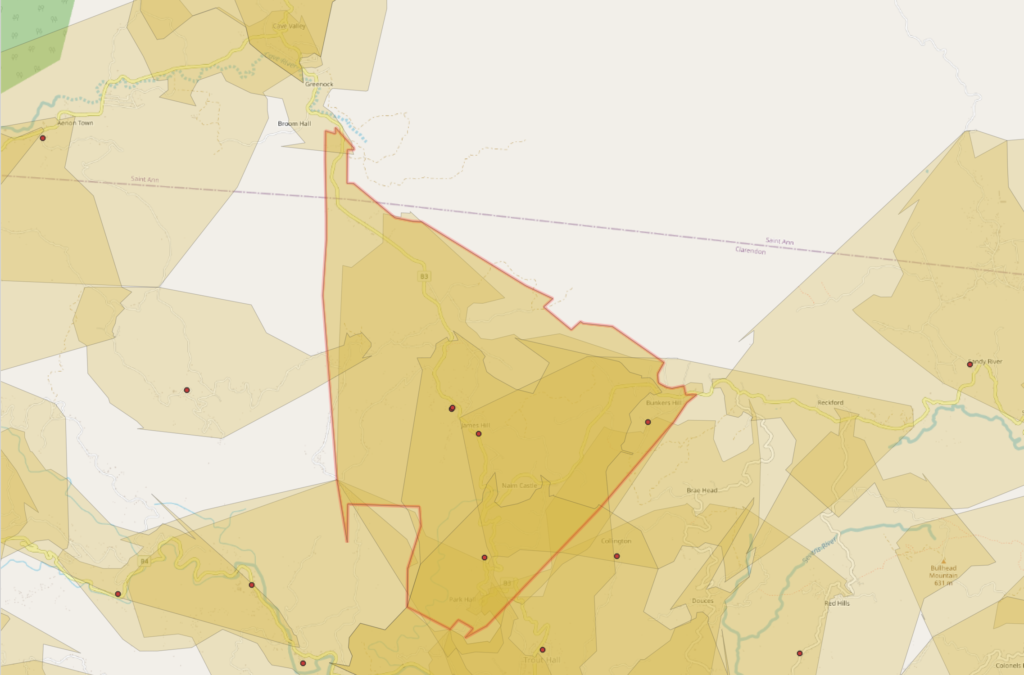
When road data is more sparse, the situation gets more difficult. In addition, missing pieces of roads in the data will result in roads that are not considered in the analysis at all, since they are not correctly connected in the network in the data. The end result will be isochrones that are deduced only from very few points of local roads, with lots of roads in the area missing or not connected, as below. Also, the shapes of the roads in the absence of crossings are simplified, so that GraphHopper only uses the end point of the 60 minute travel and does not take into account the wriggling of a single road on the way to the 60 minute point, as seen in the image below.
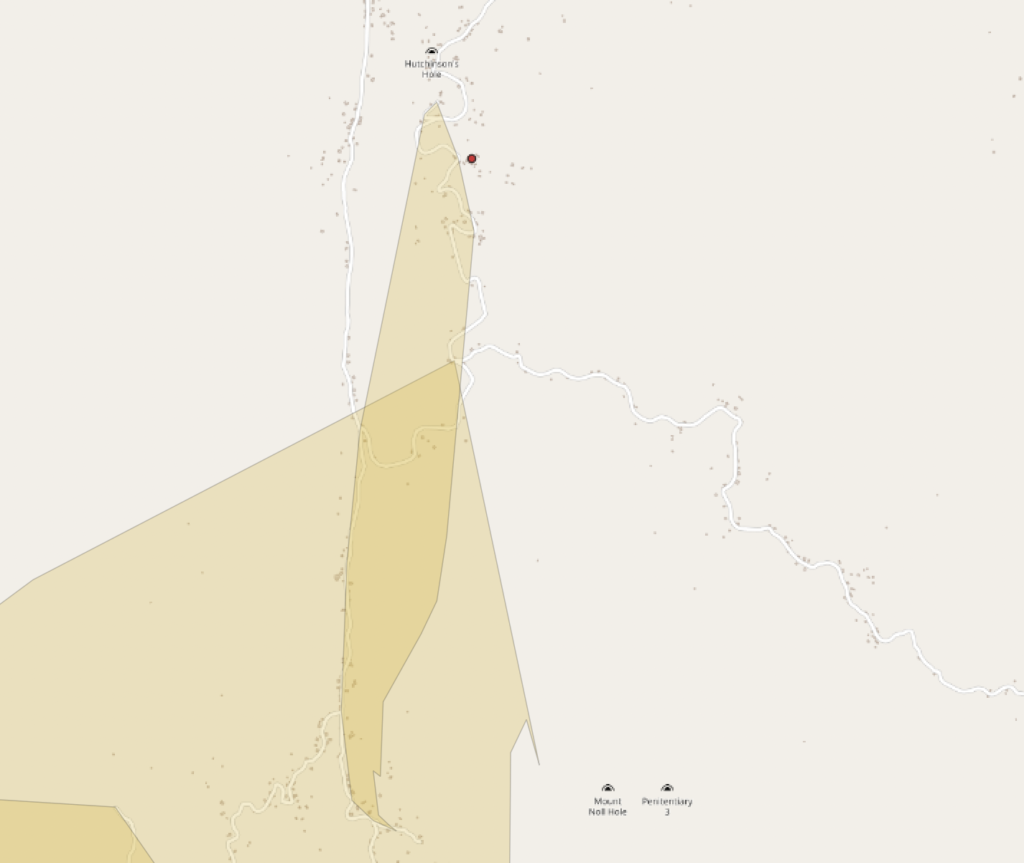
If only few roads are present, the shape of the polygon is pure guesswork. Errors in road data further decrease the size of the resulting polygon. In some cases, only very slender and simplified polygons along a single main road are produced. If areas are closer to a side road that is not connected to the main road, GraphHopper assumes such areas are not accessible from the main road. Depending on the wriggles of the road network, and on how much Graphhopper has simplified the shape of the roads, rough artefacts in polygon shapes are produced, depending on which road happens to be closest to each point in between the roads.
Such areas cannot be reliably used to estimate the number of people living within the catchment area of a school, for example, because of their arbitrary shape. Lots of people who actually have access to the school will be considered as not having access, because road data is not present in the area.
Therefore, some work is still ahead if the method is to be used for estimating accessibility in all rural settings. An obvious solution is local mapping of the roads. Another way to improve the situation would be to improve the GraphHopper code. While simplifying the road bends is crucial in doing fast calculations, the end result polygons could be constructed in a different manner. GraphHopper already has a registered issue concerning the shape of isochrones in a sparse network.
This means that instead of just taking the end points of the calculation and making simple polygons from those, Graphhopper would retain the whole network traversed up to the point and consider some buffer along the travelled roads (wriggles and all) to be included in the catchment area. Similarly, area exceedingly far from a road should not be snapped to a road. Currently, it is assumed that the travel time to the closest road is zero, while obviously travel time to the road should be taken into account.
In the most sophisticated analysis, travel time across terrain to the road would be calculated in addition to the travel along the road. However, this would result in problems in deciding which terrain is traversable. If we consider all terrain and roads to be equally traversable, we end up with perfect circles where the roads once again have no effect on the travel time.
Therefore, the calculation of catchment areas could be done in two steps. The first step would be to buffer the travelled roads with a user-configurable buffer zone. That would mean that all areas within a given distance to a road would be accessible directly from the road, even if there were a side road in the area that has no access to the main road.
This, obviously, also brings in some issues. Therefore, as a second step, such a buffer zone would be used only in the absence of other roads in the buffer zone. If a regular road network is present, the buffer would have no effect, but in a sparse network it would serve as a sensible first guess of how far a single road is accessible. In addition, travel time across terrain within the buffer zone could somehow be estimated, if we assume that traveling to a road is significantly slower than traveling on a road.
Summary
This work is yet another illustration that education does not operate in a void, and the overall quality of the data related to public infrastructure (formal roads and ways) and public behaviour (trails, lanes, etc.) is just as important as educational infrastructure.
– Amelie A. Gagnon, Senior Programme Specialist leading the Development Cluster at IIEP-UNESCO in Paris.
After the plugin development, the method was tested by educational planners in 10 countries across the globe to assess local school accessibility. While some problems were encountered due to the lack of OSM data near schools, especially in countries such as Bangladesh and Maldives which rely on water transport, the overall reception of our plugin was very positive and the early results were promising.
Therefore, our method and QGIS plugin are already in use across the globe! For a software developer, that is perhaps the best feedback there is: to know that despite missing data, a piece of software can still make a difference and improve school conditions worldwide.
You may read more on the testing and reception of the plugin in the IIEP-UNESCO blog. In the future, the method, as well as OSM data, will be improved to assess the limitations reported here, and to make it possible to reliably calculate catchment areas in a larger variety of school surroundings across the globe.
To sum it all up:
Our method of analysing school catchment areas works very well in all urban areas, because they have a dense road network and lots of users keeping the road network data in OpenStreetMap up to date. Therefore, if the majority of the population under study lives in urban or well-mapped areas, we can very well use the Catchment plugin to accurately estimate access to local education.
In rural areas, the quality of the road network data will directly determine whether the isochrones we create are close to the actual school catchment areas, and whether they will result in good or poor predictions of school accessibility. Efforts can be made with local OSM communities to connect all schools to the main road networks.
The full UNESCO-IIEP and GISPO paper will be available later in 2021, connect with development@iiep.unesco.org for more information. The QGIS plugin source code can be found on Github and the plugin itself is available in the QGIS plugins repository.
